What is a Balance Sheet?
A balance sheet is one of the key financial statements that provides a snapshot of a company’s financial situation at a specific point in time. It summarizes what a company owns and owes, as well as the amount invested by shareholders.
The balance sheet adheres to the following accounting equation:
Assets = Liabilities + Shareholders’ Equity
This means that assets, which are the resources owned by the company, must be equal to the firm’s liabilities, which are its debts and obligations, plus its shareholders’ equity, which represents the amount invested by shareholders.
This parity is achieved by adopting a principle called double-entry bookkeeping, where every asset, liability, or equity item acquired by the company (debit or credit) impacts another account within the balance sheet but on the opposite side (debit or credit).
Components of a Balance Sheet
The balance sheet includes three main components:
- Assets
- Liabilities
- Shareholders’ equity
Each component consists of several accounts. Below we provide further details.
1. Assets
Assets represent what a company owns that holds value. Assets are listed on a balance sheet in order of their liquidity, which is the ease with which they can be converted into cash. They are divided into current assets and non-current (long-term) assets.
Current assets are those expected to be converted to cash within one year.
Typical current asset accounts include:
- Cash and Cash Equivalents: This includes physical cash and assets that can quickly be converted into cash, like money market funds and short-term bonds.
- Marketable Securities: These are highly liquid investments that can easily be converted into cash, like bonds and listed equity securities.
- Accounts Receivable: Amounts owed to the company by clients for goods or services provided on credit.
- Inventory: Raw materials, work-in-progress goods, and finished goods owned by the company that will eventually be sold.
- Prepaid Expenses: Advanced payments made by the company for future services like insurance, rent, etc.
Non-current assets take longer than one year to be converted into cash. They include:
- Long-Term Investments: Financial assets expected to be converted into cash in a period longer than a year.
- Property, Plant, and Equipment (PP&E): Tangible fixed assets like land, buildings, and equipment used by the company to perform its day-to-day operations.
- Intangible Assets: Non-physical assets like patents, trademarks, copyrights, and goodwill.
2. Liabilities
Liabilities represent the financial obligations that a company owes to third parties. Like assets, they can be split into current liabilities (due in under 1 year) and non-current liabilities (due in more than 1 year).
Typical current liability accounts include:
- Accounts Payable: Money owed to suppliers and short-term creditors.
- Accrued Expenses: Expenses incurred but not yet paid, like wages owed to employees.
- Income Taxes Payable: Taxes that are owed but have not yet been paid.
- Short-Term Debt: Debt obligations of the company that are due within one year – i.e., the current portion of bank loans.
Typical non-current liabilities include:
- Long-Term Debt: Debt obligations due in over one year, like bonds and the portion of a loan’s principal that is due more than a year from now.
- Deferred Taxes: Taxes owed on income that have been deferred to future years.
- Pension Obligations: Long-term liability related to the pension plan offered by the company to its personnel.
Shareholders’ equity represents the funds contributed by shareholders plus any accumulated profits/losses. Key accounts include:
- Paid-in Capital: This is the money invested into the company through the purchase of shares.
- Additional Paid-in Capital: This represents the amount that investors have poured into the company that exceeds the nominal value of its shares.
- Retained Earnings: Cumulative net income earned over the years minus any dividends paid to shareholders.
- Treasury Stock: These are shares of the company that were repurchased from stockholders to reduce float and increase value per share.
Some companies issue preferred stock, which will be listed separately from common stock under this section.
Example of a Balance Sheet
Company XYZ Balance Sheet
As of December 31, 2023
(in thousands)
Assets
| Cash and Equivalents | $1,500 |
| Accounts Receivable | $6,700 |
| Inventory | $4,500 |
| Total Current Assets | $12,700 |
| Property Plan and Equipment | $68,000 |
| Total Assets | $80,700 |
Liabilities
| Accounts Payable | $3,600 |
| Taxes Payable | $800 |
| Total Current Liabilities | $4,400 |
| Long-Term Debt | $25,000 |
| Total Liabilities | $29,400 |
| Paid-In Capital | $1,000 |
| Additional Paid-In Capital | $21,300 |
| Retained Earnings | $29,000 |
| Shareholder’s Equity | $51,300 |
Importance of the Balance Sheet
The balance sheet is an important financial statement for several reasons:
- It communicates the book value of a company over time: The balance sheet provides the historical account of assets, claims, and ownership, which allows analysts to estimate the book value or tangible worth of the business.
- It assesses working capital and short-term financial health: The balance between current assets and current liabilities showcases the short-term solvency of the company and its ability to meet its financial obligations.
- It provides a clear picture of a business’s capital structure: The mix of debt and equity financing a company uses can be analyzed by looking at the liabilities and shareholders’ equity section.
- It provides details for ratio analysis: Important investing ratios like debt-to-equity and current ratios can be calculated by using balance sheet values.
The balance sheet is a critical financial statement that allows stakeholders to analyze the financial health of a company. It aids decision-making for management, investors, lenders, and regulators.
Balance Sheet Limitations
While balance sheets provide a snapshot of a company’s finances, there are some limitations:
- They lack trend information, unlike an income statement. Establishing comparisons with previous periods is necessary.
- Different accounting policies can distort how certain items like inventory, PPE, and long-term investments are recorded and valued.
- They involve several subjective management estimates in areas like inventory valuation and asset impairment.
- Window-dressing techniques prior to reporting dates can artificially improve appearances.
So while an indispensable tool, a balance sheet should be assessed in conjunction with other financial statements to get a more accurate picture of the business’s current financial status.
How to Analyze a Balance Sheet?
The balance sheet provides a wealth of data that allows analysts, investors, and other stakeholders to assess the financial health and performance of a business.
By calculating and interpreting important financial ratios, users can determine the liquidity, solvency, efficiency, and profitability of a company.
Here are some of the most relevant ratios for conducting balance sheet analysis:
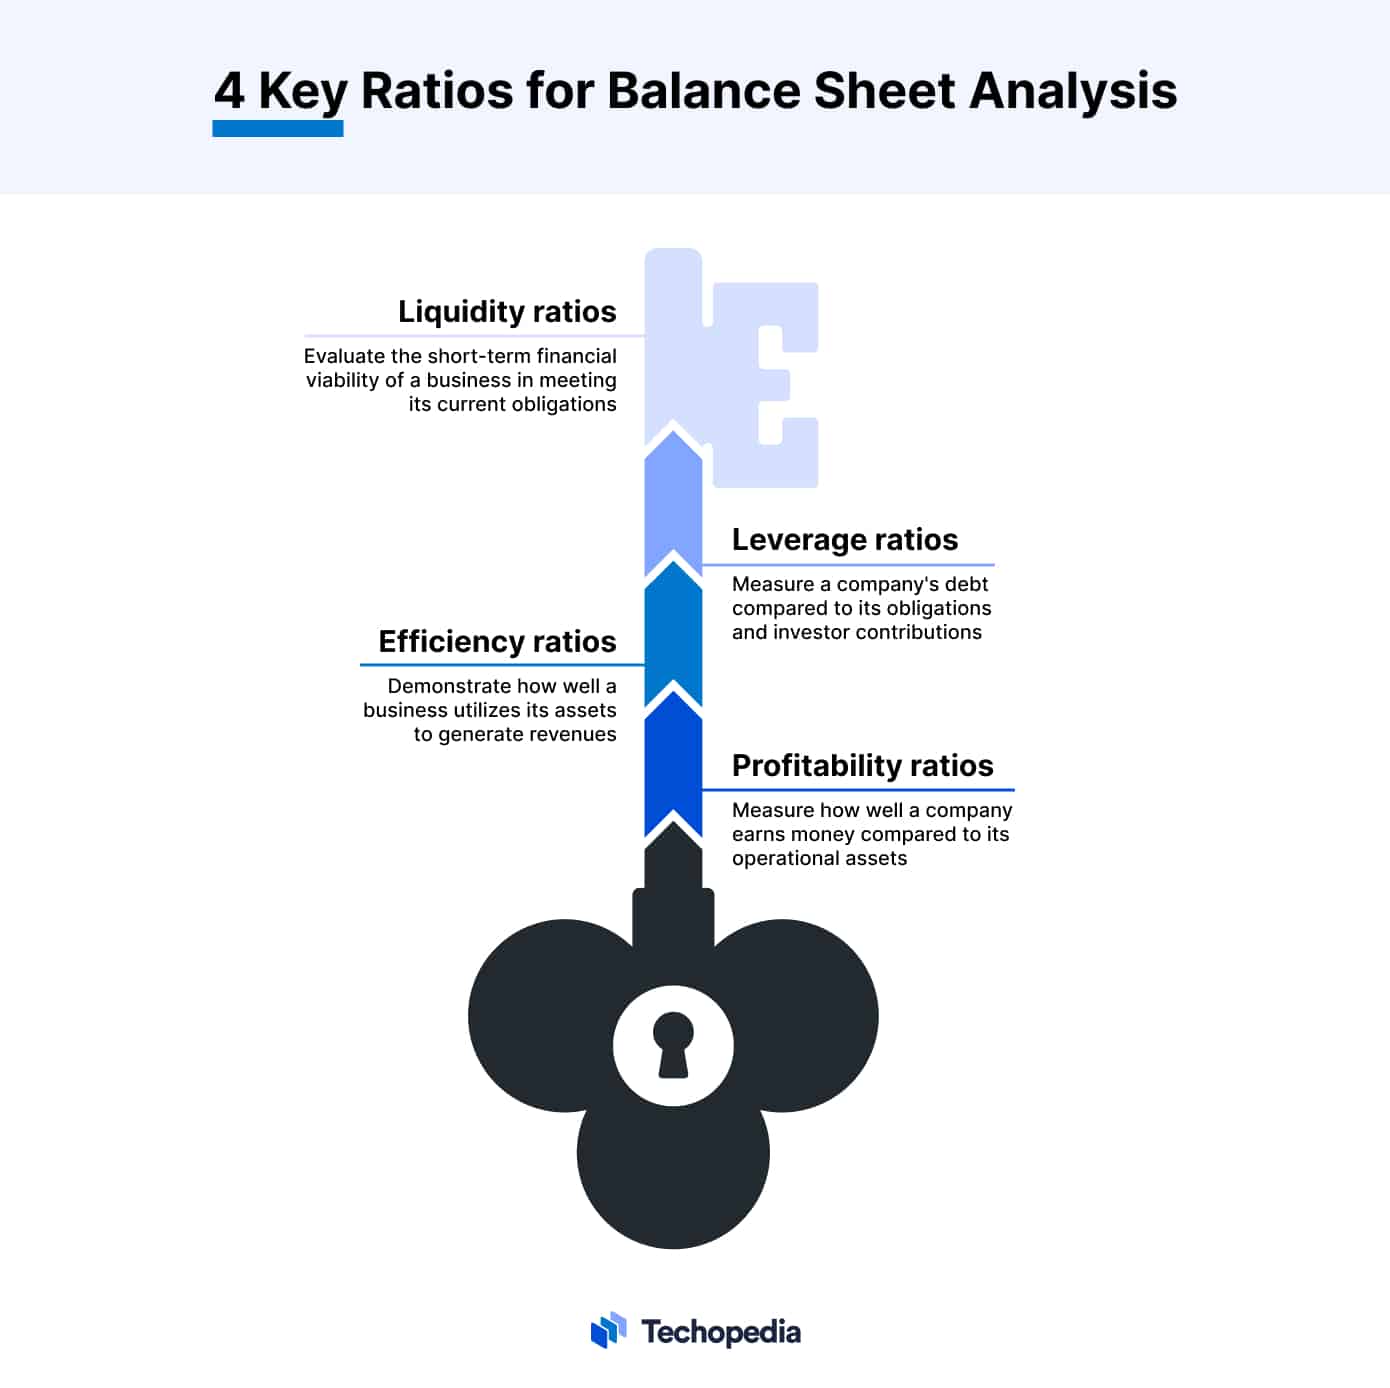
Liquidity Ratios
These ratios evaluate the short-term financial viability of a business in meeting its current obligations.
Key ratios include:
- Current Ratio = Current Assets / Current Liabilities
- Quick Ratio = (Current Assets – Inventory) / Current Liabilities
A higher number indicates greater liquidity levels and short-term financial health.
Leverage Ratios
These ratios measure the extent of a company’s debt burden in relation to what it owes and what investors have poured into the business.
Some of the most common leverage ratios are:
- Debt-to-Equity Ratio = Total Liabilities / Shareholders’ Equity
- Debt-to-Assets Ratio = Total Liabilities / Total Assets
Lower leverage ratios imply that a company is using less debt to finance its operations. Companies with low leverage are typically considered less risky from a financial and investing standpoint. However, certain opportunities may be missed due to the lack of resources.
Debt can often be used for positive purposes if there is sufficient evidence that a project or business venture can yield positive results.
Efficiency Ratios
Efficiency ratios demonstrate how well a business utilizes its assets to generate revenues. The most widely used ratios to analyze this are:
- Total Asset Turnover = Revenue / Average Total Assets
- Inventory Turnover: Cost of Goods Sold / Average Inventory
A higher number indicates greater efficiency in using assets to produce sales.
Profitability Ratios
These ratios display how much money a company generates relative to the equity or assets that are necessary to keep the business running. Some examples include:
- Return on Assets (ROA) = Net Income / Average Total Assets
- Return on Equity (ROE) = Net Income / Average Shareholders’ Equity
Higher ratios signal greater profit-generation potential from assets and equity.
By examining trends in these ratios over time and comparing them to industry benchmarks, analysts can further diagnose the operating and financial performance of a company from its balance sheet.